Page Last Updated March 2024

Regardless of your organization’s industry or vertical, today’s customer is shaping the demand for application monitoring tools. From processing loan applications to e-commerce platforms to web apps and third-party connections, organizations today need to take the time to be sure that all the software and applications in their stack, are accessible and performing smoothly. No one wants a disappointing user experience. An organization’s top priority should be to ensure that their applications are running at their peak efficiency – with minimal downtime – and APM (Application Performance Management) tools are essential in enhancing the user experiences.

There are a lot of application performance management tools on the market today, and no two are created the same. Further down in the article, we list the top APM tools in the market, along with a comparison of their key features and benefits. However, the primary goal is to find a comprehensive tool that is focused on enhancing the end-user experience.

Tips for Choosing APM Tools

Your IT environment consists of a mix of platforms, operations systems, applications, networks, etc. The alignment between business objectives and IT investment needs to be closer than ever, which is why it’s not only important to list, review, and compare multiple APM tools within your department, but to also have other departments audit them as well, ensuring that the tool you select meets your organization’s requirements. Other essential factors include:

  • Licensing costs
  • Integrations and plugins
  • Support for emerging technologies
  • Advanced alerting and reporting options
  • Global monitoring network
  • Programming languages/frameworks supported (Python, Node.js, AngularJS, Java, Ruby, etc.)

A side-by-side comparison of APM tools should quickly reveal which feature-sets are essential for your organization. Today’s user will likely be able to access your applications from anywhere in the world, via various browsers, devices, and connection speeds. Finding an application performance monitoring tool or platform that not only provides real-time visibility into your websites, web services, infrastructure and networks, but also includes features that complement your monitoring objectives, such as performance testing, is essential for developing and releasing a quality application.

A Complete List of Application Monitoring Tools

Below are 16 of the most top application monitoring tools, along with their key features, to review when considering an application performance monitoring solution for your company.

  1. Dotcom-Monitor

DCM

Founded in 1998, Dotcom-Monitor’s flagship website and APM tool, UserView, mimics a user’s journey by recording the browser actions (cursor movements, navigating, typing, etc.) of a typical user as “steps” moving within a site or web application using the EveryStep Web Recorder.  The EveryStep Web Recorder supports a wide range of RIA (Rich Internet Application) technologies, including AJAX, Flash, Flex, HTML5, Java, QuickTime, Ruby, Silverlight, and Windows Media Player.  The recorded scripts can then be re-run by each agent to ensure that content, page layout, and applications meet functionality, performance, and content standards.  In addition to their web application monitoring platform, Dotcom-Monitor also offers the following monitoring platforms:

  • WebView – Monitoring uptime, performance, and functionality of web services
  • BrowserView – Monitoring single page load times with real browsers
  • ServerView – Monitoring servers and protocols
  • MetricsView – Monitoring Windows, Linux, and custom performance counters

Dotcom-Monitor also offers a performance and load/stress testing through the LoadView platform.  Customers looking to perform load/stress testing from the cloud can quickly spin up on-demand load/stress tests, using real browsers, with thousands of concurrent users.

Key features:

  • Test from over 40 desktop/mobile browsers and devices
  • Global monitoring network
  • Monitoring from behind a firewall
  • Displays real-time information
  • API Testing
  • Integration with third-party tools
  • Chrome, Internet Explorer, and mobile device playback
  • 24/7/365 support
  1. Raygun

Stackify-Retrace

Raygun Application Performance Monitoring gives you unrivaled visibility and detail into server-side performance. Get all of the actionable diagnostics you need to answer your biggest performance questions, and deliver superior customer experiences. Raygun takes a customer-centric approach to performance monitoring, connecting your code to your customer’s experience. The APM solution can be used in tandem with their Crash Reporting and Real User Monitoring solutions to get complete visibility across your entire tech stack. It’s easy to set up and starts from as little as $8 per month.

Key features:

  • Get set up in minutes with our lightweight SDKs
    Support for .NET, Ruby, Node.js, and Azure Web Apps
  • On-demand pricing starts from just $8 per month
  • In-depth transaction details show exact method calls, including the external dependencies
  • View the exact line of code, function, database, or API call
  • Support for async/await multithreading with expandable, visual trace views
  • Overall performance timings with full trace capture with visual flame charts of every trace
  • Connect to source and display GitHub code alongside the associated trace
  1. Stackify

Stackify-Retrace

Founded in 2012, Retrace was designed with developers in mind, helping to find bugs, troubleshoot production issues, improve code, and optimize application performance.  The Stackify Retrace APM supports many common frameworks and can automatically discover all the apps on your server, helping to monitor, alert, and notify specific teams, via custom email and SMS alerts, if issues arise.  Customers also have the option to create their own custom metrics as well as monitor performance counters to measure uptime, CPU, memory, network and disk utilization.

Key features:

  • Supports .NET, PHP, Node.js, Ruby and Java applications
  • Deployment tracking to analyze application performance (Support for Jenkins, Team City, etc.)
  • Support for common frameworks (Azure, AWS, MongoDB, SQL Server, etc.)
  • Server monitoring (Windows and Linux)
  1. New Relic

NewRelic

Founded in 2008, New Relic is a multi-tenant APM platform that gives users deep insight and analytics into every part of their environment, giving users the ability to optimize application response times, transactions, and load times. View and analyze massive amounts of data and gain actionable insights, such as root-cause analysis, distributed tracing, browser-side application performance, and overall infrastructure health. New Relic offers synthetic and RUM (Real User Monitoring) options, as well as Enterprise-grade security.

Key features:

  • Synthetic monitoring (Selenium-driven Chrome browser)
  • 100+ plugins and integrations (AWS, Google Cloud, Azure, MongoDB, etc.)
  • Integration for Kubernetes
  • Mobile app (Android and iOS)
  • Analyze business impact through multiple dashboards
  • Domain-level issues
  1. Cisco

appdynamics

Acquired by Cisco in 2017, AppDynamics provides an application and businesses monitoring platform for today’s enterprises.  Their platform includes products for End User Monitoring (Synthetic and RUM monitoring), Infrastructure Visibility, and Business Performance to help manage end-to-end performance.  Deploying agents throughout the environment, AppDynamics gives teams a view into their app topology, regardless of the environment, through customizable dashboards, giving metrics and data to make informed business decisions and driving application performance.

Key features:

  • View specific data regarding user visits
  • Database/Server/Application visibility
  • Code-level diagnostics
  • Transaction snapshots
  • Supports technologies such as Java, .NET, PHP, Node.js, and others
  • Machine and infrastructure-level metrics
  • 150+ Integrations (AWS Cloud, PagerDuty, Docker, etc.)
  1. SolarWinds

SolarWinds provides tools and technology that helps IT manage their infrastructure.  Through their AppOptics platform, this APM tool allows for monitoring across the stack, providing insight to into various application performance dynamics over historical releases.  The AppOptics solution supports cloud and hybrid environments and provides monitoring and visibility into infrastructure and applications, along with supporting metrics and analytics.

Key features:

  • Supports many popular frameworks and languages (Java, .NET, Python, PHP, Ruby, etc.)
  • 150+ integrations and plugins (AWS, Apache, MongoDB, NGINX, MySQL, etc.)
  • Live dashboards and customizable alerts
  • View behavior of individual requests in real-time
  • Collect and correlate custom metrics (cURL commands, open-source agents)
  • Implement trace methods during production
  • Identify and remedy bottlenecks within applications
  1. Dynatrace

Dynatrace

Founded in 2005, Dynatrace offers a variety of automated testing for various web performance issues.  Geared toward modern enterprises, the Dynatrace APM is an all-in-one, AI powered solution.  Dynatrace’s all-in-one approach integrates all kinds of monitoring, from user-experience and application monitoring to server and network monitoring.  Dynatrace recently announced that they are sunsetting their Synthetic Classic platform in 2019.

Key features:

  • Mobile app monitoring (Android, Apache Cordova, iOS, and PhoneGap)
  • Replay user experience across browsers, interfaces, and devices
  • Performance Lifecycle Management (supports Java, .NET, Node.js, and PHP)
  • Insight into failure rates, CPU, memory, and network traffic
  • Monitoring for mainframes (IBM System Z)
  • Application structure and optimization
  • Server monitoring – health metrics down to the process level
  1. Datadog

DataDog

Founded in 2010, the Datadog APM platform offers a look at web performance from a comprehensive dashboard. An all-in-one monitoring service, Datadog can monitor, troubleshoot, and optimize application performance across your stack – hybrid cloud applications, servers, databases, and applications.  Datadog recently announced their integration with Cloudability, support for serverless monitoring (AWS Lambda), and the addition of a synthetic monitoring solution, called Datadog Synthetics.  A beta version for Datadog Synthetics will be available in December 2018.

Key features:

  • Supports popular web frameworks (Django, Ruby on Rails, Gin, and Spring)
  • Utilizes machine learning to detect errors
  • Alert integrations (Slack, HipChat, and Campfire)
  • 250+ integrations (AWS, Apache, Azure, Docker, GitHub, Java, Jira, Kubernetes, Microsoft Team, etc.)
  • Monitor containers, cloud instances, on-premises, and hybrid architectures
  • Map data flows
  • Customizable dashboards
  1. Smartbear

SmartBear builds tools for development, testing, and operations teams for monitoring software applications and websites. Their APM suite includes API lifecycle products, software testing platforms, application monitoring tools, and code collaboration and optimization tools. SmartBear has recently acquired the continuous testing platform, HipTest, as well as test management solution, Zephyr.

In October of 2018, they announced a new cloud-based load testing platform called LoadNinja.

Key features:

  • CrossBrowserTesting platform runs Selenium-based tests in the cloud (supports desktop and mobile browsers)
  • TestLeft automates functional tests for web and desktop applications
  • Create and playback scripts with InstaPlay Recorder for load testing
  • API testing (REST and SOAP)
  • QAComplete organizes your tests in one place
  • Synthetic monitoring for web and API’s monitoring
  • DejaClick plugin for point and click scripting
  1. Alertbot

AlertBot, a service of InfoGenius, is a fully integrated, cloud-based APM platform for monitoring websites, mobile, web applications, and other web services from an end-user perspective.  When an issue is detected, the service sends an immediate alert, giving the appropriate teams time to fix the issue before more users are impacted.

Key features:

  • Basic HTTP monitoring and full-page functionality
  • Server monitoring (IMCP Ping, TCP, SMTP, POP3, IMAP, DNS, FTP, Telnet, and custom ports)
  • Monitor multi-step processes with TrueBrowser recorder
  • Supports monitoring from real browsers (Chrome, Internet Explorer, Safari, Firefox, Opera)
  • Custom alerts (text, email, voice, team member escalation)
  • Monitor mobile websites and applications
  • Failure analysis reports (waterfall charts)
  1. Uptime Robot

Founded in 2015, Uptime Robot provides basic website uptime monitoring from multiple global locations through an easy-to-use interface, alerting IT teams when downtime issues occur. Uptime Robot offers their product through a free forever plan and a Pro Plan for customers looking for additional features, such as SSL monitoring, advanced notifications, and 1-minute monitoring intervals.

Key features:

  • Integrations (Slack, Microsoft Teams, Telegram, PagerDuty, OpsGenie, VictorOps)
  • HTTP(S) monitoring
  • Ping (ICMP) requests
  • Keyword checks
  • Port (SMTP, DNS, PORT)
  • REST API
  • 1-year of log data
  1. Uptrends

Founded in 2007, Uptrends provides cloud-based website performance and network monitoring for managing uptime, performance, and functionality of your sites, API’s, and infrastructure. With over 200+ checkpoint servers, their APM tool is one of the few on the market that combine both synthetic monitoring and real user monitoring in the same package.

Key features:

  • Web performance monitoring supports real browsers (Chrome, Internet Explorer, Firefox)
  • Server monitoring (DNS, FTP, email servers, SQL databases, web servers)
  • Web application monitoring (Google Chrome browser extension)
  • Mobile app available for Android, iOS, and Windows
  • SSL Certificate monitoring
  • Integrations support for Slack, PagerDuty, and StatusHub
  • Private checkpoints for internal applications and infrastructure
  1. Splunk

Founded in 2003, Splunk is an APM platform for searching, monitoring, and analyzing machine-generated big data. Splunk has acquired several companies throughout 2018, including Krypton, VictorOps, and Phantom. Additionally, they announced their recent integrations with the AWS Security Hub.

Key features:

  • Central, unified view of IT services through dynamic dashboards
  • Insights for Infrastructure (infrastructure monitoring and troubleshooting)
  • AWS cloud monitoring
  • Enterprise security
  • Task automation and workflows via Phantom
  • Collect and send data through Universal Forwarder
  1. Monitis

The Monitis APM platform provides an all-in-one solution for monitoring websites, applications, servers, and networks, as well as custom monitoring solutions, for IT specialists.  Through a centralized dashboard, customers are able to view current uptime, health, and performance of their websites, servers, and networks.

Key features:

  • Uptime monitoring (HTTP(S), Ping, DNS) from 30+ locations
  • Email monitoring (SMTP, POP3, IMAP)
  • Integrations support for Jira, OpsGenie, Zapier, Slack, VictorOps, PagerDuty, AWS CloudWatch
  • Server monitoring checks CPU, memory, storage, disk, and bandwidth
  • Application monitoring supports Java, Perl, PHP, Ruby, and C#
  • Real user monitoring (RUM) and Synthetic transaction monitoring (Chrome and Firefox) available.
  • Web page stress tests
  1. Pingdom

Acquired by the SolarWinds Cloud family in 2014, Pingdom has been helping companies optimize page speed and performance through their web tools and APM software platform since 2007, ensuring that companies big and small are delivering a consistent experience to their customers.

Key features:

  • Uptime monitoring from over 60+ global locations
  • Synthetic transaction monitoring (Chrome browser)
  • Real User Monitoring (called Visitor Insights)
  • Filmstrip and timeline metrics
  • Mobile app available for Android and iOS
  • 90+ open-source plugins and integrations (VictorOps, AlertOps, PagerDuty, Slack, Zapier, etc.)
  • Server monitoring
  1. Site24x7

Founded in 2006, the Site24x7 APM platform offers SaaS based server, website, and application performance monitoring for DevOps and IT operations. From more than 90 global locations, they can monitor uptime and performance of your critical webpages and applications.  In September of 2018, Site24x7 announced support for Chrome within their Web Transaction Browser.  In November 2018, they announced that their Azure monitoring will leverage AI to help IT teams identify issues more quickly.

Key features:

  • Application performance monitoring supports Java, .NET, Ruby, PHP, AWS, Azure, and additional mobile platforms
  • Server monitoring (Windows, Linux, FreeBSD, VMware, and Docker)
  • Measure round-trip time with email monitoring (SMTP, POP, and IMAP)
  • Public and private cloud monitoring (AWS, Azure, VMware)
  • Synthetic web transactions (Selenium-based) for Chrome and Firefox
  • Network monitoring (routers, switches, and firewalls)
  • 50+ plugin stack integrations (Nagios, MongoDB, Apache, Hadoop, Tomcat, WordPress, etc.)

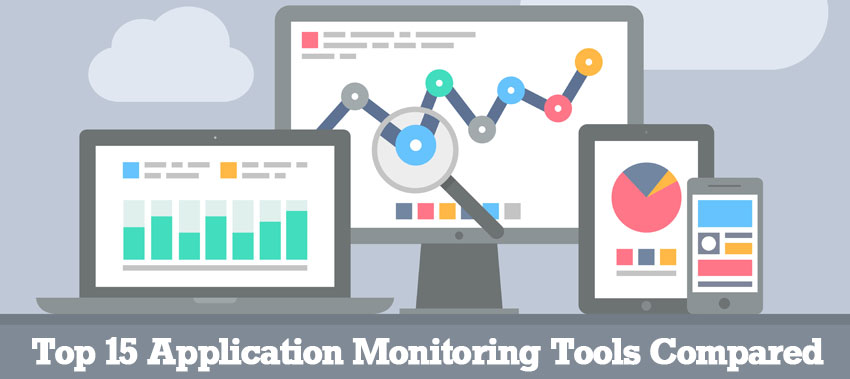
Application Management & Monitoring Tools – Your Questions Answered

Selecting the right APM is overwhelming as there are many factors to consider.  Each tool provides slightly different feature sets and some tools only provide visibility into certain layers of your stack versus complete visibility.  Additionally, some tools are designed to run only on specific operating systems.  It’s critical to carefully look at every solution to be sure that it meets budget and specification requirements.  However, the primary goal is to find a comprehensive tool that centers on analyzing and enhancing the performance of the end-user experience.


Q:  What is an APM (Application Performance Monitoring) tool?

A:  The definition of APM has been evolving along with industry trends and new technologies, so not everyone agrees on clear-cut definition, but essentially, an application performance management (APM) tool allows you to monitor and manage the performance and uptime of your software applications. For example, using an APM tool allows IT teams to monitor the speed and response times of applications to maintain their SLA (Service Level Agreements). If that application dips below a specific threshold, the team can be alerted immediately, diagnose the issue, and potentially avoid any bottlenecks or delays.  Most importantly, the goal of any APM tool is to ensure an optimal end user experience.

Proper APM tools should also work with any type of website and/or web hosting. Whether you’re working with WordPress or another type of platform, it shouldn’t affect the usage of APM tools and monitoring. One thing to consider though, is if you’ve built a web application on WordPress, you should work to ensure that you’re using the best WordPress hosting available to you in order to minimize performance issues. The top WordPress hosting companies (such as WP Engine, etc.) should also do their own performance testing on their back end to make sure they are no bottlenecks or problems with uptime/performance.

Beyond just measuring standard web page or application speed and uptime, there are other tools within the APM framework that can be leveraged to help manage an organization’s entire infrastructure – synthetic monitoring, real user monitoring (RUM), performance testing (load/stress testing), business transaction management, and data and analytics.


Q:  Why is an APM tool important?

A: An application performance monitoring tool not only ensures that your applications are performing as expected, or responding quickly, but also performing consistently. Your users can access your applications at any time of the day.  Ensuring a consistent experience is critical in maintaining a positive user experience. Not only that, having consistent performance and understanding the stability of your underlying systems allows you to predict how they will perform with varying levels of traffic or activity. What would happen if the number of application users’ triples? How would that affect CPU, memory, and disk utilization? Having an APM tool lends itself into capacity planning. Being able to predict performance based on user load allows you to ensure your users always get a high-quality experience.

Another reason why application performance monitoring tools are important is they can support multiple technologies, programming languages, frameworks, integrations, etc. This ensures your teams aren’t using multiple, disparate tools.  Today’s applications can be complex and dynamic. APM tools can be utilized in every part of the application development process, from development and testing to production, allowing teams to develop and create higher quality applications, faster. Company’s today depend on applications to drive revenue and growth.  The right application performance monitoring solution is critical to ensuring a positive user experience and driving the bottom-line.


Q:  Which APM tools are right for my website?

A:  Reviewing and finding the right APM tool can be a laborious task, as there are many factors and vendors to consider. And not all APM tools are created equally.  Each vendor provides different levels of features, functionalities, and support.  Some tools only provide visibility into all layers of your IT stack versus some free versions that just monitor basic uptime and performance. It’s important to match your environment with an appropriate APM tool. Additionally, some application monitoring tools are designed to run only on specific operating systems. So, it ultimately depends on your organization’s needs and budget, but with so many tools on the market today, you should be able to find one that works for you.


Q:  Are Application Performance Management tools expensive?

A: The short answer is that it depends on the vendor.  Products and solutions from the leading application performance management vendors, such as AppDynamics, New Relic, and Dynatrace, for example, can be very expensive on a per month basis.  But what you’re getting in return are enterprise-level platforms that have advanced features, such as artificial intelligence, machine learning, full-stack monitoring and integration, hundreds of integrations, and support for the latest emerging technologies. These platforms give organizations a full, comprehensive view into their entire environment. Users can drill down into specific transactions and review individual metrics.  However, one of the drawbacks to powerful platforms such as these is that there can be a steep learning curve.  These are not platforms you can just begin using out of the box. In some cases, individuals must be trained and certified before they can implement these solutions or organizations must have dedicated staff on-hand to manage these platforms.

The majority of vendors today cover the essential needs and uses cases organizations require, such as:

  • Monitoring and improving application uptime and performance
  • Root-cause analysis
  • Dashboards
  • Reporting and alerting features
  • Security

One of the great things about having so many APM solutions available, is that there are many other vendors that offer solutions below the enterprise level pricing tiers. And because we live in a SaaS-based world, these platforms have the ability to scale to meet the changing needs of organizations.


Q:  What makes Dotcom-Monitor stand out as an Application Performance Management tool?

A: Dotcom-Monitor leads the APM industry and is used by major household brands like Comcast and Dell. DevOps teams around the world leverage Dotcom-Monitor to keep their websites and web applications performative and online without unnecessary downtime, with a direct impact to user experience and finally their business’ bottom line.

With the most powerful and realistic monitoring and testing experience on the market, Dotcom-Monitor uses real browsers and users to perform monitoring, so results are as true to life as possible. This leads directly to cleaner data and better insights that developers can then integrate into their development roadmap for their critical websites and applications.

Dotcom-Monitor also makes collaboration between developers and other functions straightforward and effective with customized reports ranging from executive summaries to element-level reports and charts developers will find immediately useful. You can also set custom alerts for your team members as voice messages, SMS, emails and more, and filter your alerts so the most important notifications make it to the right people without delay.

Don’t let unnecessary downtime negatively affect your business. Register for a free 30 day Dotcom-Monitor trial and begin monitoring your websites and web applications today.